
Home › Mac Apps › GraphPad Prism

GraphPad Prism 11.1.0 (Mac)
Updated
The catalogue note
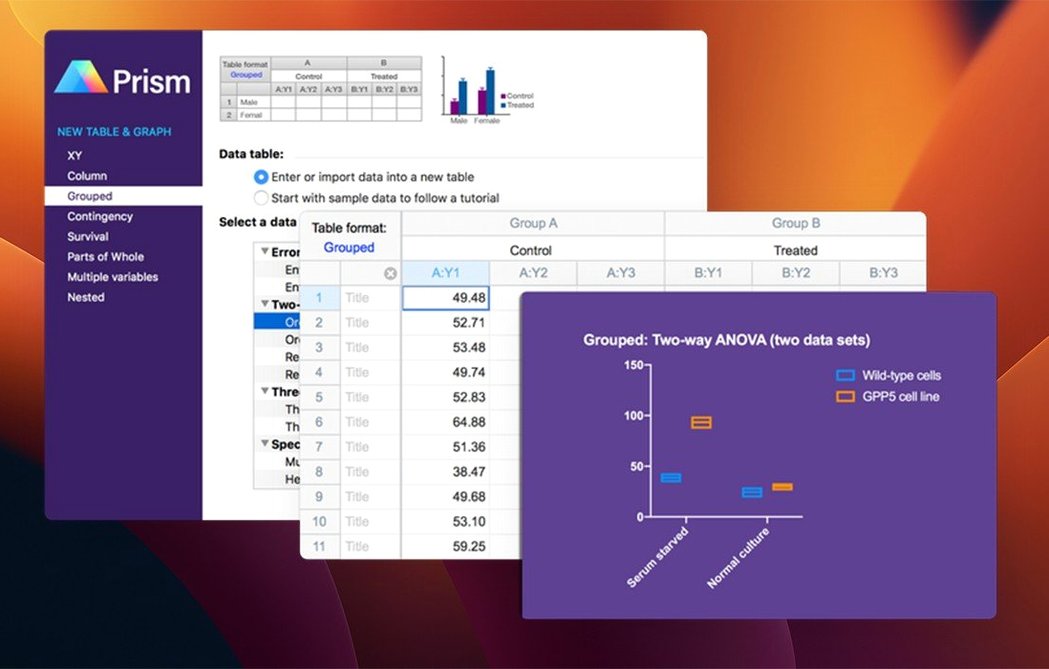
Analysing experimental data often means juggling a stats package, a curve fitter, and a plotting tool, then stitching the results together. GraphPad Prism 11.1.0 for Mac pulls those three jobs into one application, so you move from raw numbers to a publication-ready graph without switching context.
- Biostatistics built in – t tests, ANOVA, contingency tables and survival analysis are available from the same workspace as your data, no separate module needed.
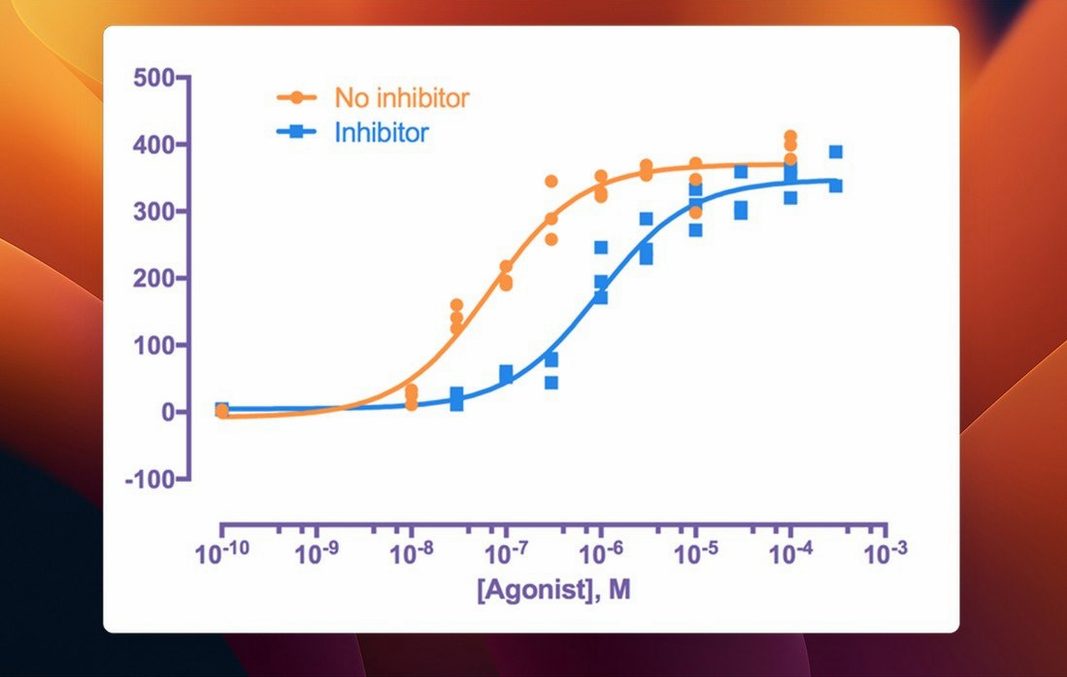
- Nonlinear regression – fit curves to standard models or define your own equations; the results table includes parameters, confidence intervals and goodness-of-fit stats.
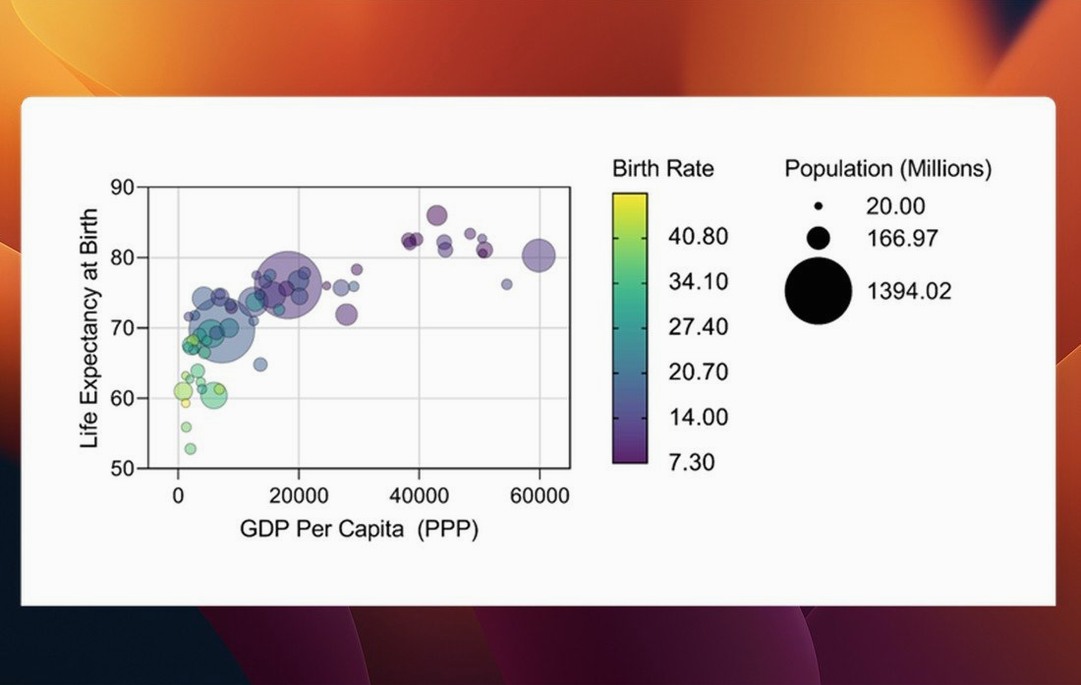
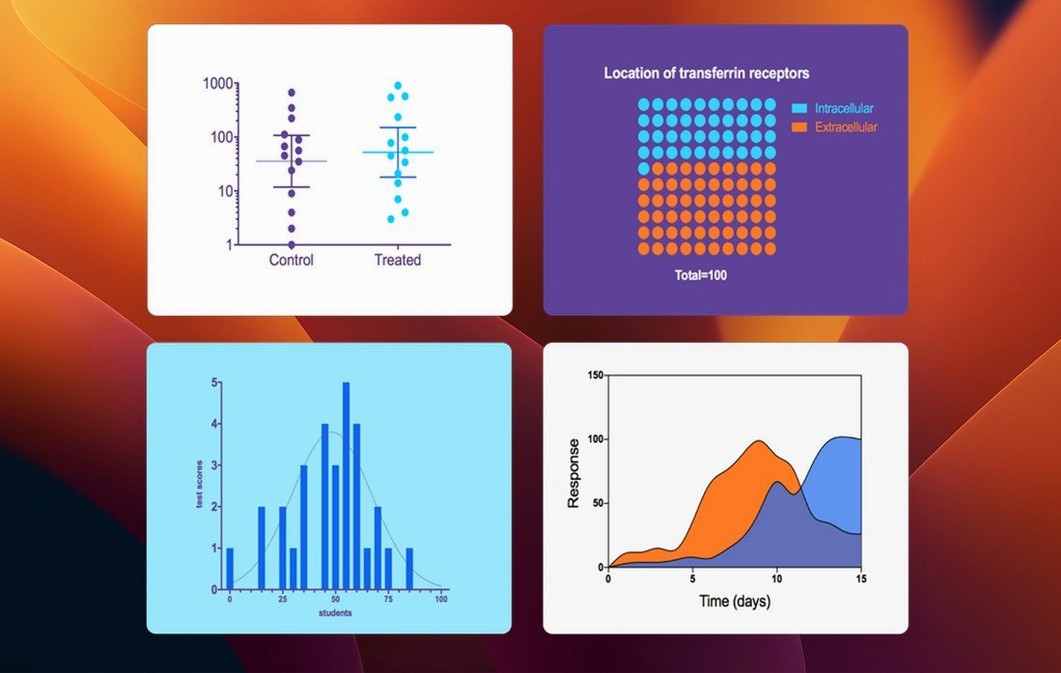
- Scientific graphing – organise data in structured tables and choose from a wide range of graph types, including the new bars, box-and-whisker and violin plots for multiple variables tables introduced in 11.1.0.
- Streamlined analysis dialogs – variable selection is now simpler, and categorical level ordering gives you more control over how groups appear.
- Cross-platform and current – available for Windows and Mac, supports Apple Silicon and Intel 64-bit Macs, and requires macOS 11 or later.
- Stability improvements – this release includes more than 60 bug fixes while keeping the familiar workflows intact.
For a lab that lives on graphs, Prism 11.1.0 is a solid update: new plot types where they count, less friction in the analysis dialogs, and the same dependable engine underneath.
Spend ten minutes with the built-in sample data sets
Once you drag GraphPad Prism into your Applications folder and launch it, resist the temptation to jump straight into an old project. Spend ten minutes with the built-in sample data sets — they ship with the application and demonstrate how the structured data tables map to different graph types. This is particularly useful if you are moving from a general-purpose spreadsheet, where the data layout is often freeform. Prism expects each row to represent a subject or replicate, and each column a treatment or time point; getting that mental model right from the start saves rework later.
Next, open the Preferences panel and check the default graph template. Prism applies a set of formatting defaults (font sizes, axis scales, colour schemes) that are sensible for a generic journal, but your lab or department may have specific requirements. Adjusting the template once at the beginning means every new graph inherits your preferred style — no need to reformat each one manually.
Finally, confirm that your licence activation works before you need it. Version 11.1.0 adds browser-based licence activation for enterprise SSO environments, so if your institution uses single sign-on, test the flow while you have time to troubleshoot.
Purpose-built for experimental scientists with structured experiments
Prism is not a general statistics package; it is purpose-built for experimental scientists who run repeated, structured experiments and need to present results clearly. The following kinds of Mac users get the most out of it:
- Biomedical researchers – if your work involves dose-response curves, EC50 calculations, or time-course data, the nonlinear regression engine handles the fitting and reports the parameters you need for publication.
- Biostatisticians – the ability to choose a statistical test based on your data structure, rather than hunting for the right command in a terminal, saves time and reduces the chance of selecting the wrong test.
- Graduate students and postdocs – when you are preparing figures for a thesis or a manuscript, having the stats and the graph in one application eliminates the back-and-forth between R and Illustrator. The new multiple variables graph types (bars, box-and-whisker, violin plots) are directly applicable to modern experimental designs with many groups.
- Contract research organisations – any lab that produces graphs for external clients benefits from the consistent formatting and the built-in reporting of statistical results alongside the figure.
If your work rarely involves structured experimental data — for example, you mostly run surveys or analyse text — a general statistics tool or a spreadsheet may serve you better. Prism's strength is its focus on the bench scientist's workflow.
Avoid treating Prism's data tables like a spreadsheet
Several pitfalls show up repeatedly when people start using Prism:
- Treating it like a spreadsheet – Prism's data tables are not freeform cells. Entering data in arbitrary locations or leaving blank rows in the middle of a table confuses the analysis engine. Keep each table rectangular, with one row per subject or replicate, and use separate tables for separate experiments.
- Ignoring the data table type – Prism offers different table formats (e.g., XY, Column, Grouped, Contingency, Multiple variables). Selecting the wrong type when you create a new project limits the analyses and graph options available. If you are unsure, start with the Multiple variables table type introduced more prominently in recent versions; it adapts to many common layouts.
- Running the wrong statistical test – the built-in test chooser helps, but beginners sometimes click through it without reading the assumptions. Check whether your data meets the normality and equal-variance requirements before running a parametric test; Prism includes diagnostic graphs (QQ plots, residual plots) that are easy to overlook.
- Overcomplicating the graph – it is tempting to add every statistical comparison, error bar type, and annotation to one figure. Prism lets you layer elements freely, but a cluttered graph obscures the message. Use the new categorical level ordering feature in 11.1.0 to control how groups appear, and keep the number of comparisons visible.
New graph types for multiple variables tables in the latest update
If you were already using Prism 11.0.x, the update to 11.1.0 brings a few practical improvements that affect daily work:
- New graph types for multiple variables tables – bars, box-and-whisker plots, and violin plots are now available directly from tables with multiple categorical and continuous variables. Previously, you might have needed to restructure the data or create these plots manually. Now they appear as standard options in the graph gallery.
- Categorical level ordering – you can define the order in which categories appear on axes and in legends. This is a small change that has an outsized effect when you prepare figures for a journal that expects treatments listed in a specific sequence, or when you want control groups to appear first.
- Streamlined variable selection – the parameters dialogs for t tests, multifactor ANOVA, nonlinear regression, and simple survival analysis now require fewer clicks to select the variables you need. If you run the same analysis repeatedly, the saved time adds up.
- Browser-based licence activation – for users in institutions with enterprise SSO, the activation flow no longer requires entering a licence key manually into the application. The browser handles authentication, which works better with modern security policies.
- Over 60 bug fixes – the release addresses a range of issues across data import, graph rendering, and analysis calculations. None of these are headline features, but they make the application more predictable day to day.
The core workflow — enter data, run an analysis, generate a graph — remains unchanged. The improvements in 11.1.0 remove friction in specific areas rather than redesigning the interface.
Changes in this build
- New graph types for multiple variables tables.
- Categorical level ordering for multiple variables data tables.
- Streamlined variable selection in analysis dialogs.
Before it goes on the Mac
- macOS 11 or later
- Apple Silicon or Intel 64-bit
- Interface language: English
Questions from the room
What macOS versions does GraphPad Prism 11.1.0 support?
Prism 11.1.0 requires macOS 11 or later and works on both Apple Silicon and Intel 64-bit Macs.
What graph types were added in version 11.1.0?
Version 11.1.0 adds new graph types for multiple variables tables, including bars, box-and-whisker plots, and violin plots.
Is GraphPad Prism available for Windows as well?
Yes, GraphPad Prism is available for both Windows and Mac.
Installing it on the Mac
- Open the downloaded disk image.
- Drag the app to the Applications folder.
- Launch the app from Launchpad after copying finishes.
Notes from the control room
Sign in or open a catalogue account to leave a note.
No notes from the room yet. If you have used this build for a week, a short note helps the next person.