
Home › Mac Apps › MotionVFX mInfographics
MotionVFX mInfographics (Mac)
Updated
The catalogue note
You are cutting a corporate case study or a product launch video. The client wants a clean chart showing market growth, not a boring bar animation imported from a separate app. That is where MotionVFX mInfographics sits: directly in your Final Cut Pro timeline, as a Titles plugin.
- Drag the chosen infographic element from the Titles browser onto your timeline.
- Use the on-screen controls to adjust the data values, number ranges, or caption text.
- Customise the typographic styling through the Inspector — font, size, colour, alignment.
- Render the chart or graph in context; the element respects your timeline length for animation duration.
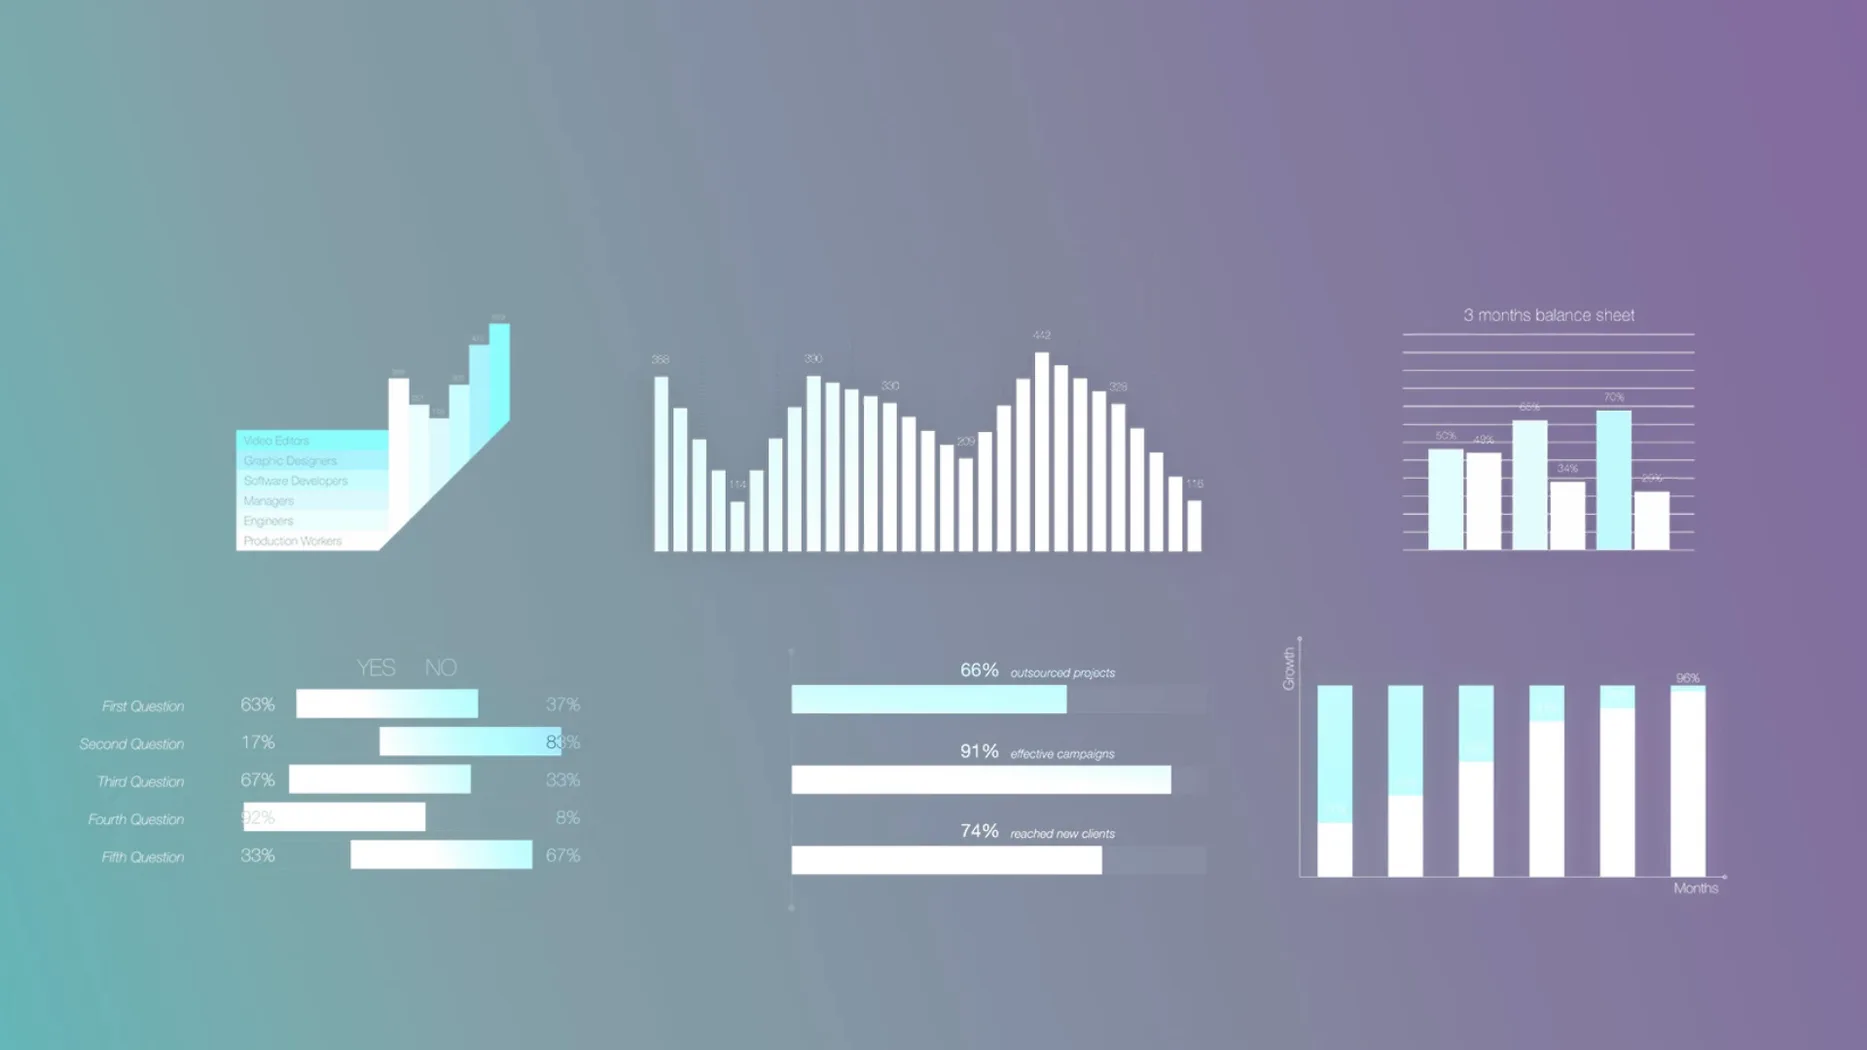
With 60 elements covering bar charts, line graphs, pie charts and informational captions, mInfographics covers most data-visualisation needs without leaving Final Cut Pro. All elements are in English. The workflow stays inside the edit — no round-tripping to a motion graphics application.
On-screen controls now update predictably during playback
The current version of mInfographics refined how the on-screen controls respond to quick parameter changes. Editors who adjust number ranges or captions while the playhead is moving will find the preview updates more predictably — the plugin now holds its last rendered state until the playhead stops, rather than flickering through intermediate values. This makes live adjustments during client review sessions less distracting.
The typography engine also received attention. Text fields in the Inspector now accept pasted values from spreadsheets or notes without stripping formatting that affects line spacing. For anyone building data-heavy sequences, this means fewer manual corrections after pasting market-share percentages or revenue figures.
Beyond that, the installer package was reorganised. The folders now include a clear naming convention that matches Final Cut Pro's own Title categories, so you can find mInfographics elements alongside your existing lower thirds and credit rolls without digging through a generic folder. No activation step is required — the same unpack-and-move process applies.
Finished a quarterly review with bar, pie, and line graphs in one session
I had a Thursday morning slot booked to finish a quarterly review video. The producer wanted a bar chart comparing four regional sales figures, then a pie chart showing market share, and finally a line graph for year-over-year growth. All inside Final Cut Pro, no round-tripping.
I opened the Titles browser, clicked the mInfographics category, and scanned the thumbnails. The first element I picked was a stacked horizontal bar chart. I dragged it onto a new connected storyline above the main interview track. The default duration was five seconds — enough for a narrator to read the key number.
The on-screen controls appeared immediately. I grabbed the handle for the first bar and dragged it up until the tooltip read 42. That covered the EMEA region. Second bar to 28, third to 18, fourth to 12. The colours stayed consistent with the brand palette I had set in the Inspector earlier.
Next, the pie chart. Same process: drag from Titles, position on timeline, adjust the segments via the on-screen sliders. I wanted the largest slice to sit at the top, so I rotated the whole element until the percentages aligned with the voiceover cue. The caption below the chart read "Market share by region" in the default sans-serif, which I changed to the company font via the Inspector's typography section.
The line graph took the longest. I had six data points for two product lines. I adjusted each point by clicking and dragging the on-screen nodes, then set the line thickness to match the visual style of the bar chart. The animation duration matched the timeline clip length, so the line drew itself over three seconds, then held for the remaining two.
By the end of the session, I had three infographic elements synced to the narration, all styled consistently, and no render glitches. The producer watched the timeline playback, nodded, and moved on to the next scene.
Dropping infographics on the primary storyline breaks their behavior
The most common error is dropping an infographic element onto the primary storyline instead of a connected clip. The element behaves as a title — it needs its own layer above the video. When placed directly on the storyline, it either replaces the video or creates an unexpected gap. Keep it on a connected storyline or a secondary track.
Another mistake is ignoring the on-screen controls and trying to edit everything through the Inspector. The on-screen handles are faster for adjusting values visually; the Inspector is better for fine-tuning typography and alignment. Using only one method often leads to imprecise placements or repeated undo steps.
Beginners also tend to leave the default animation duration untouched. Each element animates over the full length of its timeline clip. If you drop a five-second clip onto a ten-second gap, the animation stretches and the data appears too slowly. Trim the clip to the exact length you need, or adjust the timing by splitting the element.
Finally, some editors forget that the text fields support multi-line captions. They cram a long description into a single line, which then overflows or gets clipped. Use the Inspector to enable line breaks or adjust the text box size — the typographic styling handles multi-line content cleanly.
Creating a five-department budget pie chart from start to finish
Task: create a pie chart showing budget allocation across five departments for a finance team's update video.
Place your video or interview clips on the primary storyline.
Step 2: In the Titles browser, locate the mInfographics category. Choose a pie chart element — the one with five segments and a central label works well. Drag it onto a connected storyline above the video track.
Step 3: Adjust the clip duration. For a pie chart that needs three seconds to animate and two seconds to hold, set the clip length to five seconds in the timeline.
Step 4: Use the on-screen controls to set each segment's value. Click the handle for the first segment and drag until the tooltip shows the correct percentage. Repeat for the remaining four. The chart updates in real time, so you can see the segments resize as you drag.
Step 5: Open the Inspector. Under the title controls, find the typography section. Change the font to match your organisation's brand guidelines. Adjust the colour of each segment if needed — the Inspector lists each segment as a separate colour swatch.
Step 6: Add a caption below the chart. The element includes a text field for a description. Type "Budget allocation by department — FY2024" or similar. Use the Inspector to set the caption size, alignment and line spacing.
Step 7: Play back the timeline. The pie chart animates in, the segments grow from the centre outward, and the caption fades in beneath it. If the timing feels off, trim the clip or split it at the point where the animation should stop.
Step 8: Export the final video. The mInfographics element renders as part of the Final Cut Pro timeline — no additional steps or external rendering required.
Before it goes on the Mac
- macOS version not specified
- Intel and Apple Silicon
- Final Cut Pro
Questions from the room
Can I change the numbers and labels on the charts?
Yes, mInfographics includes number and description customisation, plus on-screen controls for adjusting data values directly in the Final Cut Pro timeline.
What kind of infographic elements are included?
The pack contains 60 universal elements including charts, graphs, and informational captions with typographic styling, suitable for data visualisation.
Installing it on the Mac
- Unpack the downloaded folders.
- Move the folders to
/Users/USERNAME/Movies/Motion Templates/Titles.
Notes from the control room
Sign in or open a catalogue account to leave a note.
No notes from the room yet. If you have used this build for a week, a short note helps the next person.